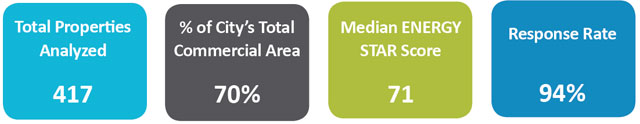
A new analysis of energy use for 417 public and commercial buildings in Minneapolis reveals that they have the combined potential to save $27 million per year on energy costs by increasing their energy efficiency to reduce consumption by 15 percent.
The City of Minneapolis’ Energy Benchmarking Report analyzed the 2015 energy use of 264 commercial and 153 public properties that submitted data to the City as required by the building energy benchmarking and transparency ordinance (building owners had until June 2016 to submit data). The buildings in the report include 107 million square feet of floor space and account for more than 8.1 million mmbtu (million British thermal units) of total energy use, which is the equivalent use of about 102,000 households or roughly 60 percent of the households in the city. This is the final phase of the four-year tiered rollout, and all energy and water data associated with properties covered under the ordinance is now public.
In the Minneapolis Energy Benchmarking Report:
 Of the buildings reporting, hospitals, worship facilities and offices showed the greatest potential for energy savings.
- The median Energy Star score for all buildings was 71. The median score was 70 for public buildings and 76 for private properties. (Energy Star scores range from 1 to 100, with 100 being the best and 50 being the national median. A building that scores 75 or higher is eligible for Energy Star certification. The City offers Energy Star certification grants to buy down the cost of certification for benchmarking buildings.)
- Energy performance in public buildings showed promising trends toward the City’s goals. A preliminary three-year analysis indicated a 4 percent reduction in energy use. (The calculation is adjusted for weather variables).
- Energy performance in private buildings remained fairly unimproved between 2014 and 2015 with median Energy Star scores changing from 79 to 78. The other metric, total weather-normalized energy use per square foot, dipped less than 1 percent.
- Compared to the last report, more data and better quality data came in; 94 percent of required buildings submitted responses to the data request by the deadline compared to 90 percent last year.
Download the report to learn more >>
Visit the Minneapolis benchmarking website >>
Read case studies of Minneapolis buildings >>
Check out a presentation about the city-wide benchmarking effort
About the Local Government Energy Action Series:
This effort tells the stories of Minnesota municipalities, counties, and schools and the tangible results of their energy-saving efforts to inspire others to take their own actions.