
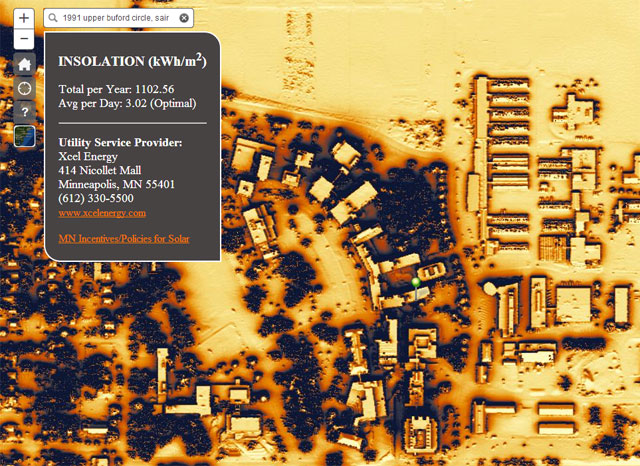
The Minneapolis Solar Suitability map is a red, orange, yellow, and grey patchwork of the city’s rooftops. Click on a colored building, and a text box appears, stating “This building has good solar potential!” and an estimate of the total kilowatt-hours of solar energy that the surface could generate each year.
Red, orange, or yellow buildings have sufficient solar insolation and space to install at least 1,000 watts of useful solar panels. Grey buildings are not suitable for solar photovoltaic systems, but few buildings fall into this category.
Brendon Slotterback, Minneapolis’ Sustainability Program Coordinator and creator of the map, used methodology, data, and inspiration from the University of Minnesota’s Minnesota Solar Suitability App and from student research from the Humphrey Institute. To generate the map, he overlaid solar insolation data with building footprints. While this map is limited to Minneapolis city limits, Slotterback emphasizes that any community could create a similar map using data provided by the University of Minnesota (more on that below).

A view of the Minneapolis Solar Suitability Tool (click to try it out)
Slotterback believes the map has two primary purposes.
- The first is functional: the map is a resource to determine the best place to install solar panels. For those interested in installing panels, the map links to information on solar installers, federal tax incentives, and Minnesota utility rebate programs. For the city, the map could illustrate the interaction of land use planning and solar installations, or help Minneapolis to encourage people with significant potential to pursue solar energy.
- The second purpose of the map is communication. The map illustrates that most rooftops in Minneapolis could install at least 1,000 watts of solar energy. It also shows that established resources can help building owners install solar panels. The map is a way of spreading the word: the potential for solar energy exists; all that remains is to start using it.
Click here to access the map, or visit the City of Minneapolis web page to learn more about it!
Don’t live in Minneapolis? There’s an app for you, too.
Those outside Minneapolis also have a resource they can use: the Minnesota Solar Suitability App. This statewide map of solar insolation and solar photovoltaic (PV) potential has 1 square meter resolution for the entire state of Minnesota. Just like the Minneapolis map, it was created using Lidar data and GIS technology. The Minnesota Solar Suitability App can be accessed with a computer or mobile device at http://maps.umn.edu/solar. More information can be found on the project website at http://solarp.uspatial.umn.edu. Other local governments and organizations who are interested in manipulating local solar suitability data—as done by the City of Minneapolis—can download layers by county from the MN Solar Suitability App. All requests for data and other inquiries should be directed to [email protected].
A view of the Minnesota Solar Suitability App (click to try it out)