Policy, Alignment, and Business Scale

Wind Energy to Green Ammonia

WCROCs wind to ammonia facility

Wind Energy to Green Ammonia

Policy, Alignment, and Business Scale

June 30, 2022

By The Clean Energy Resource Teams, University of Minnesota West Central Research & Outreach Center, and the Agricultural Utilization Research Institute.

The original purpose of this project was to understand the scale at which a green hydrogen and ammonia facility would be commercially viable.

Why consider this? Nitrogen fertilizer accounts for approximately 36%, and grain-drying (fueled by methane) adds another 42%, respectively, of the fossil energy footprint from corn production. If we were to replace the fossil-based nitrogen fertilizer with electrolysis-based green ammonia from wind- or solar to-ammonia developments and use green hydrogen as a fuel for grain-drying, we could readily remove 78% of the fossil energy footprint from corn production.

Thus, the team proposed a feasibility study to analyze the policy and financial landscapes for electrolysis-based green hydrogen and ammonia in relation to Minnesota and neighboring states. Additionally, the team proposed to outline the most likely geographic and financially viable scenarios with an aim of understanding whether this is a worthwhile agribusiness opportunity for farmers and their communities based on where anhydrous ammonia and urea are used in Minnesota, as well as available sources of clean electric generation, and transmission capacity.

Photo of West Central Research and Outreach Center's wind to ammonia facility.

Since launching this effort in 2021, the context for this work has changed in several key ways:

  • DOE has launched a call for Hydrogen Hubs and the overall interest in and discussion of hydrogen, and ammonia as a hydrogen carrier, has grown.
  • The war in Ukraine has refocused attention on ammonia prices and supply chains including with regard to how natural gas prices impact ammonia prices and the potential resilience benefits of local, renewably sourced ammonia.
  • Discussion of new H2 incentives have shaped potentially favorable economics to drive investment in this sector, bring down the cost of electrolyzers, and help accelerate the path to green hydrogen and ammonia.

A few of the key takeaways:

  • Using renewable energy to produce green ammonia in distributed facilities has the potential to offer multiple benefits because agricultural areas of Minnesota are also rich in wind energy and therefore could be used to produce a key agricultural input—fertilizers—locally while perhaps utilizing renewable energy resources that might otherwise be curtailed. 
  • The rise in use of urea speaks to the potential value of colocation of green ammonia facilities with ethanol production facilities as this could enable the use of the CO2 (a waste product from ethanol production), in combination with the green ammonia, to create urea.
  • Major cost drivers for green ammonia production are the capital costs to build the facility (think: electrolyzers!) and the operational costs to keep the plant running while delivering a return on investment. Operationally, green ammonia production is cost-competitive with gray (methane-based) ammonia production, and it adds potential benefits in terms of reducing vulnerability to price shocks resulting from variations in natural gas prices.
  • Frameworks that could help drive down the cost of electrolyzers from $700/kWh to closer to $200-300/kWh or could support increasing the utilization factor of facilities (from 30% to 60% or higher) would help this technology satisfy the expectations of commercial financing. 
  • As hydrogen and ammonia can be used for many purposes beyond fertilizer, commercializing a system for fertilizer (a known market and technology) could begin to scale deployment, enabling future applications for energy storage, transport, and use across the state and region.

Photo of West Central Research and Outreach Center's wind to ammonia facility.

Next: Summary

Use the tab menu at the top of the page to navigate across the study.


Expansion of wind and solar has reduced electricity sector GHG emissions and provided economic benefits to rural communities. However, Minnesota’s agricultural sector has not seen comparable reductions in GHG emissions. These emissions include:

  • Methane emissions from livestock production: these can be reduced through changes to livestock diet and manure management practices.
  • Nitrous oxide emissions from denitrification in agricultural soils: these can be reduced through on-farm nitrogen management practices.
  • Fossil fuel use for fertilizer production and on-farm machinery: these can be reduced through electrification and green ammonia, which is the focus of this study.

Historically, ammonia has been produced through steam-methane reforming (SMR) in combination with the Haber-Bosch process. This method uses natural gas as a feedstock. This “gray” ammonia may also subsequently be converted into urea, which is distributed in granular form. Most agricultural ammonia (and urea) used in Minnesota is imported from North Dakota and Iowa.

However, there are other options for producing ammonia, including the use of wind energy to produce “green” ammonia through electrolysis of water to produce hydrogen, which is then combined with nitrogen to produce anhydrous ammonia through the Haber-Bosch process.

In addition to its use as fertilizer, green ammonia can be used as a form of chemical energy storage. It has potential uses as a carbon-free fuel for use in internal combustion engines, electricity generation, or thermal applications (e.g., grain drying). It can also be used as a low-cost hydrogen carrier and cracked for use (e.g., fuel cells). These applications are still under development but show significant promise. 

As might be expected for a region with extensive crop production, the Midwest has robust existing markets and distribution systems for (gray) ammonia and urea. Therefore, if production of green ammonia and urea were established within the region (or, more locally, within Minnesota), there is an existing industry that could make ready use of it. This industry would, however, need to compete with the established gray ammonia industry, so efforts to decarbonize ammonia production in ways that support farmers and Minnesota’s rural communities will depend on both the policy environment and economics.

Limited transmission capacity on the electric grid has meant that a significant amount of affordable renewable energy goes unused—or is not constructed in the first place. Using renewable energy to produce green ammonia in distributed facilities thus offers multiple potential benefits:

  1. Because agricultural areas of Minnesota are also rich in wind energy, a key agricultural input can be produced locally, using local energy resources that otherwise might go unused, and providing economic benefits to Minnesota’s rural communities.
  2. Colocation of green ammonia facilities with ethanol production facilities enables the use of the CO2 (a waste product from ethanol production), in combination with the green ammonia, to create urea, a preferred fertilizer.
  3. Dependence on fossil fuels (and accompanying emissions) is reduced for the agricultural sector. Vulnerability to external shocks and supply chain issues is also reduced.

Proximity to substation infrastructure, high voltage power lines, and utility-scale renewable energy generation are necessary for the financial viability of green ammonia. Minnesota’s strongest wind energy resources and some of its transmission assets align well with its areas of highest corn production. This, combined with Minnesota’s existing markets and distribution systems for ammonia and urea, could facilitate a transition to green ammonia. 

To consider the economics of distributed ammonia production, AURI modeled facilities at 25, 50, 100, and 250 tons per day (tpd) of ammonia production. All of these sizes are much smaller than typical natural gas-based ammonia facilities, which average 1500 tpd in the United States. For context, a 250 tpd facility would supply approximately 50% of current Minnesota ammonia demand and would be 10x larger than any existing electrolytic plant worldwide.

Major cost drivers for green ammonia production are the capital costs to build the facility and the operational costs to keep the plant running while delivering a return on investment. Operationally, green ammonia production is cost-competitive with gray (methane-based) ammonia production, and it adds potential benefits in terms of reducing vulnerability to price shocks resulting from variations in natural gas prices.

However, the capital costs for a 250 tpd green ammonia facility are estimated to be double that of a typical natural gas to ammonia facility of the same scale. This difference is largely attributed to the cost of the electrolyzers and the need to overbuild the facility to achieve production when utilizing a variable power source. 

To achieve returns that would satisfy the expectations of commercial financing, the cost of cells would need to fall and/or the utilization factor would need to increase. This could be accomplished either through incentives (to reduce capital cost or increase the profit margin) or through consistent access to power (to increase utilization factor). 

Despite green hydrogen and green ammonia’s application potential in Minnesota and the Midwest, there is a gap with respect to incentives for developing the industry here. Existing low carbon fuel credit standards on the West Coast are designed to support and protect their West Coast market: wind or solar process energy that makes clean fuels will not deliver carbon credits under the West Coast regulatory structures. Another option, the federal tax credit for carbon credit and sequestration technologies, may present the possibility of additional financing options for green ammonia in the future, though it is unclear at this point whether green ammonia/urea would qualify for the credit. A third possibility—a green hydrogen incentive—has been proposed but not yet passed.

With respect to power supply, possible options include physical power purchase agreements (PPA) or virtual power purchase agreements (VPPA). If enabled by regulation, VPPAs could help guarantee consistent access to power and the siting of generation facilities where they are most advantageous to the electric grid, though existing transmission constraints would need to be considered.

Large and centralized is often the path of least resistance. However, having green ammonia production distributed across the region is a potentially beneficial path. It could be scaled to local use cases, would be less power constrained, could potentially free up power movement by providing a local demand sink, and would also reduce logistics and transport costs. Finally, because hydrogen and ammonia can be used for many purposes beyond fertilizer, commercializing a system for fertilizer (a known market and technology) could begin to scale deployment, enabling future applications for energy storage, transport, and use across the state and region.

Next: Introduction

Introduction: The Rural Energy Context

For decades, the electric utility and agricultural industries have navigated the expansion of wind and solar power together. Renewable energy developers have worked with farmers and rural communities for land access to build wind and solar farms and to expand transmission. Land lease payments, energy production taxes, and property tax revenue all benefit rural communities: annually, Minnesota landowners receive around $10 million in wind lease payments1, while Minnesota local governments receive over $14 million in production tax revenue from over 4,000 megawatts of clean energy capacity.2 Though these developments have not been without controversy, the partnership has, overall, been beneficial for both utilities and rural communities.

Through these investments, Minnesota’s electricity generation sector has made large strides in reducing greenhouse gas (GHG) emissions. Supportive policy instruments (mandates and tax credits) have combined with market competition to create an environment in which a build-out of large wind and solar farms and the high voltage transmission grid has been able to reduce the electricity sector’s GHG emissions in Minnesota by 29% during the 2005-2018 period.3

The rapid expansion of large-scale wind and solar power has, in fact, out-matched transmission capacity. Currently, a significant portion of cost-effective renewable energy is either curtailed or not even constructed4 due to insufficient hosting capacity on the electric grid.5 The MN Department of Commerce and electric utilities are researching,6 constructing, and operating thermal7 and metal battery storage facilities8 to capture intermittent wind and solar energy for later dispatch to align with load consumption. In a similar vein, green ammonia (ammonia produced using renewable energy) presents a significant chemical energy storage and fuel opportunity that aligns the electricity and agricultural sectors in their GHG reduction goals.

This is particularly important given that, while the electricity sector has seen significant reductions in greenhouse gas emissions, this has not been the case for the agricultural sector. In Minnesota, 22% of greenhouse gas emissions come from agriculture, forestry, and land use. These emissions now rival emissions from transportation and electricity sectors.9 In light of increasing market and environmental pressure from Minnesota-based agribusiness corporations and government agencies, farmers have a stake in identifying ways to reduce their GHG emissions that also make sense from a farm business perspective. Major emissions sources associated with the agricultural sector include nitrous oxide (N2O), methane (CH4), and carbon dioxide (CO2), each of which can be reduced using technologies and practices either already available or currently under development:

  • Methane emissions from livestock production, which increased by 15% during 2005-2018, could be reduced through changes to livestock diet and manure management practices.
  • Nitrous oxide emissions from agricultural soils, which increased by 12% during the same period, have the potential to be reduced through on-farm nitrogen management practices like optimizing the amount, timing, and method of manure and fertilizer application.
  • Carbon emissions from fossil fuel use for fertilizer production (ammonia and urea) and on-farm machinery and heating (typically propane and diesel) could be reduced through a combination of electrification and green ammonia.

Emissions from nitrogen fertilizer production alone are significant. Globally, ammonia production accounts for 2% of greenhouse gas emissions, and 80% of that production goes into fertilizer. Locally, the West Central Research and Outreach Center found that at its own facility, 36% of the fossil energy footprint came from nitrogen fertilizer.10

Wind to green ammonia developments can reduce greenhouse gas emissions in agriculture by serving as a direct replacement solution for nitrogen fertilizer produced with fossil fuels, simultaneously providing a mechanism to capture and utilize excess renewable energy generation and bolstering resilience by enabling more distributed, locally sourced options for fertilizer production.

Furthermore, the potential of green ammonia extends beyond its current use as fertilizer. Ongoing research at the West Central Research and Outreach Center and elsewhere suggests possible uses of ammonia as a carbon-free fuel for engines (such as tractors), and thermal applications (like grain drying). In addition, because ammonia (NH3) costs less to store and transport than pure hydrogen (H2), it has potential applications as a hydrogen carrier (such as for use in fuel cells). The possible applications for ammonia as energy storage are thus wide-ranging: transportation, mining, home and commercial heating, maritime applications, and non-wires solutions to local supply challenges faced by electric utilities.

This flexibility of ammonia uses—as fertilizer and as energy storage medium—presents another potential opportunity for the electric and agricultural industries to expand together. If a viable business model is developed for the distributed production of green ammonia for fertilizer, it has the potential to remake the rural energy economy in ways that support resilience in Minnesota’s agricultural sector and rural communities, while also reducing GHG emissions and increasing efficiency in the energy sector.

Whether Minnesotans choose to build these developments in a distributed or centralized manner is an open question. This study considers some of the factors necessary for a distributed development model of green ammonia production.

Next: Ammonia Production

Ammonia Production: A Rainbow of Technological Change

Historically, synthetic ammonia has been produced through a steam-methane reforming method, which relies on high volumes of natural gas and heat to produce hydrogen. Natural gas molecules are split into carbon dioxide, carbon monoxide, and hydrogen by combining natural gas with steam at a 1004 degree Fahrenheit (540 degree Celsius) temperature, and the hydrogen is purified. In a separate phase, an air separator filters ambient air and separates molecules into nitrogen and oxygen. Lastly, the hydrogen and nitrogen are catalyzed in the Haber-Bosch process to form anhydrous ammonia. The ammonia may also subsequently be converted into urea, a form of fertilizer made by combining anhydrous ammonia with carbon dioxide. It is distributed in granular form. Most agricultural ammonia used in Minnesota is imported from North Dakota and Iowa.


Figure 1: Conventional Ammonia

Figure 1: Production Process for Conventional (Gray) Ammonia


Hydrogen separation is central to ammonia (NH3) production: the key challenge to producing low-carbon ammonia is tied to producing low-carbon hydrogen. In conventional “gray” ammonia production, hydrogen production accounts for 90% of GHG emissions.11 To address this issue, a variety of alternatives to gray ammonia have been developed, each designated by a color name. These various methods are summarized in Table 1. As shown in the table, investments are currently being made in these alternatives to conventional gray ammonia.

This study will focus on green ammonia, which is produced by deriving hydrogen from water electrolysis, then combining it with nitrogen from an air separator. These elements are catalyzed through the Haber-Bosch process to form anhydrous ammonia.12 Note that there is no difference in the ammonia produced; the difference is in the means for producing the hydrogen that is fed into the Haber-Bosch process.

 
Table 1: Ammonia Production Methods
Type Hydrogen Process and Emissions Recent Midwest Investment Examples

Gray: Steam-methane reforming

Conventional SMR hydrogen production using natural gas and steam at high temperatures. Significant GHG emissions. Dominant method of ammonia production.
 

Blue: Steam-methane reforming with carbon capture

SMR with carbon capture and storage: geological sequestration to keep greenhouse gases from reaching the atmosphere. Bakken Energy currently in conversation with Basin Electric Cooperative to purchase assets of Dakota Gasification Company, including Great Plains Synfuels Plant in Beulah, ND. If agreement is reached, estimated 340,000 tons of blue hydrogen will be produced annually, using natural gas from the Bakken Formation and existing hydrogen production infrastructure.13 Emissions to be stored in the Formation.14

Turquoise: Pyrolysis of methane

Pyrolysis: Methane streamed through carbon or molten salts at high temperatures in a zero-oxygen environment. Carbon coagulates in the reactor. Requires 4-5 times less electricity than electrolysis. Creates carbon black, a soil amendment and nanostructure material.15 No CO2 emissions. A Nebraska corporation, Monolith Materials, has been acquiring capital investment16 and structuring green power purchase agreements17 for several years in preparation to commercialize hydrogen and ammonia in addition to their existing carbon black production.18 

Pink: Nuclear powered (electrolysis or thermal water decomposition

Electrolysis: Nuclear powered electricity is used in an electrolysis unit for hydrogen production, or in the electrolysis of high-temperature steam produced from nuclear power waste heat.19 Thermal decomposition: Copper-chlorine or sulfur-iodine compounds used to split water into separate hydrogen and oxygen streams. Nuclear powered electricity and nuclear energy process heat power the thermochemical units. Advantages in producing hydrogen at large scales.20 No greenhouse gas emissions. November 2020: Xcel Energy and Idaho National Laboratory announced a partnership based on a $14 million grant from the U.S. Department of Energy. The partnership aims to deploy high-pressure steam electrolysis at Xcel Energy’s Prairie Island Nuclear Generating Station.21

Green: Renewable energy powered electrolysis of water

Electrolysis: Renewable energy (e.g. wind) used to power electrolysis of water. No greenhouse gas emissions. University of Minnesota West Central Research and Outreach Center hosts a wind to ammonia pilot facility.


Figure 2: Production process for green ammonia

Figure 2: Production Process for Green Ammonia


Next: Minnesota’s Agricultural Nitrogen Marketplace

Minnesota’s Agricultural Nitrogen Marketplace: Consumption, Production, and Pricing

Green ammonia—particularly distributed production of green ammonia—offers significant potential benefits across multiple sectors of Minnesota’s economy, particularly in rural communities. Assessing the potential for its adoption in Minnesota’s agricultural regions (and beyond) requires understanding the current market for nitrogen-based fertilizers. As might be expected for a region with extensive crop production, the Midwest has robust existing markets and distribution systems for (gray) ammonia and urea. Agricultural nitrogen sales in all forms for Minnesota have been steady at approximately 770,000 short tons annually since 2010 (Figure 3).22 Anhydrous ammonia has seen a decline in use since 2013 (down to approximately 150,000 tons), with a correlating increase in urea use to over 350,000 tons yearly (Figure 4).


Chart of Agricultural Nitrogen Sales from 1989=2017

Figure 3: Agricultural Nitrogen Sales from 1989-201723


Chart of Minnesota Nitrogen Sales Over Time

Figure 4: Minnesota Nitrogen Sales Over Time, MN Department of Agriculture24


Urea, which, as previously noted, is synthesized from anhydrous ammonia and carbon dioxide, is used for the same agricultural purposes as anhydrous ammonia and produces comparable crop yields. Urea is stored and applied in granular form, which reduces handling, storage and transportation costs relative to other dry forms of nitrogen. It also has minimal fire and explosion hazards. There are several reasons for the rise in urea use in lieu of anhydrous ammonia, including flexibility in the timing of fertilizer application over larger acreage, easier and faster to apply using precision farming techniques to reduce labor costs and trips across farm fields, ability to mix other agricultural nutrients with granular urea, and ability to coat urea with materials for a slow-release effect and efficient plant uptake.25 For example, in West Central Minnesota, conversation with the New Horizons CHS facility confirmed that ammonia has been largely phased out of the cooperative’s fertilizer program due to the shift in fertilizer management practices by growers.26

Because ammonia is the precursor for urea, the considerations raised with respect to the ammonia market also apply to urea. In addition, as will be seen in the section on siting of facilities, the importance of urea as a fertilizer also suggests possible synergies between production of ethanol and that of ammonia and urea.

In the Upper Midwest overall, most agricultural nitrogen fertilizer is produced through the conventional steam reforming method in North Dakota and Iowa. Though the North Dakota and Iowa Departments of Agriculture do not record export sales of ammonia fertilizer to neighboring states, they are known to be the major suppliers to Minnesota’s agricultural market.27 Some of the major producers include:

  • Dakota Gasification Company, a subsidiary of Basin Electric Cooperative located in Beulah, ND, which garnered $66 million (for urea), $40.5 million (for anhydrous ammonia) and $22.3 million (for ammonia sulfate), for a total of $128.8 million in revenue from wholesale agricultural fertilizer sales in 2020.28
  • In Iowa, a $3 billion fertilizer production facility opened for business in 2017 near the town of Wever. The Iowa Fertilizer Company, a facility of international conglomerate OCI, produces approximately 940,000 tons of anhydrous ammonia, 510,000 tons of granular urea, and 1.9 million tons of liquid urea ammonium nitrate fertilizer on an annual basis.29
  • CF Industries completed a $2 billion expansion to its Port Neal, Iowa facility in 2019. The expansion tripled nitrogen fertilizer production to 3,500 tons per day30 or approximately 1.2 million tons per year.31
  • Green Valley Chemical in Creston, IA produces approximately 32 million tons of anhydrous ammonia per year.32
  • Across the Mississippi River in East Dubuque, IL, CVR Partners produces 1,075 tons per day of ammonia and 1,100 tons per day of urea ammonium nitrate.33

In addition, since 14% of ammonia in the US market overall is imported from other countries, US ammonia prices closely track prices on the international market, which in turn track natural gas prices. These prices, always volatile, have trended dramatically upward in recent years (Figure 5).34 With no local production, and Minnesota reliant on ammonia produced elsewhere and imported through the supply chain, this volatility impacts Minnesota's agriculture spending and speaks to the potential local economic opportunity of local green ammonia production.


Charts of U.S. ammonia prices rise in response to higher international natural gas prices

Figure 5: U.S. ammonia prices rise in response to higher international natural gas prices35

Next: Getting It from There to Here

Getting It from There to Here: Existing Ammonia Distribution

Ammonia distribution across the Great Plains is largely patterned on crop type and farm application (Figure 6).

Until its closure in 2020, the Magellan Pipeline (Green pipeline in Figure 7) carried 900,000 tons/year of anhydrous ammonia and delivered to terminal storage in Mankato, MN.36 Now, in Minnesota, most forms of anhydrous ammonia are imported via rail and truck transport.

When transported by rail or by truck, anhydrous ammonia is shipped in a liquefied state under pressure. The anhydrous ammonia is raised slightly from its liquid state of -28 degrees Fahrenheit (-33.3 degrees Celsius) for loading, depending upon outside temperature. Rail cars and truck tanks are insulated and pressurized. These logistics costs make up a significant portion of the final cost to farmers, adding up to $100-200 per ton.37


Map of acres treated with commercial fertilizer, lime, and soil conditioners as percent of total cropland acreage.

Figure 6: Acres Treated with Commercial Fertilizer, Lime, and Soil Conditioners as Percent of Total Cropland Acreage38


Map of U.S. Ammonia Plants and Pipelines

Figure 7: U.S. Ammonia Plants and Pipelines39


Minnesota has several large terminal ammonia storage tank facilities: 

  • The Glenwood Facility, owned by CF Industries, is a 60,000-ton anhydrous ammonia storage tank that supplies 50,000 tons of anhydrous ammonia annually.
    • The facility is close to a 69 kV AC power line shared between Xcel Energy and Runestone Electric Cooperative.
    • Anhydrous ammonia is delivered under pressure by rail with a secondary mode of delivery by cargo tank truck.
  • The Rosemount Facility, owned by CF Industries, is a 62,000-ton anhydrous ammonia storage tank.
    • The facility is in Xcel Energy service territory in close proximity to a 115 kV AC line that is tied to a 345 kV AC line approximately half a mile away.
    • Anhydrous ammonia is delivered under pressure by rail with a secondary mode of delivery by river barge.
  • The Garden City facility, owned by Koch Industries, is a 30,000-ton anhydrous ammonia storage tank.
    • The facility is in BENCO Electric Cooperative service territory in close proximity to a 69 kV AC power line and less than 10 miles to a 345 kV power line.
    • Anhydrous ammonia is delivered under pressure by truck cargo tank with no secondary mode currently available.
  • The Murdock facility, owned by Koch Industries, is a 30,500-ton anhydrous ammonia storage tank.
    • The facility is in Agralite Electric Cooperative service territory with no high voltage power line identifiable nearby.
    • Anhydrous ammonia is delivered under pressure by truck cargo tank with a secondary mode of delivery by rail, also under pressure.

In addition, there are over 200 retail and distribution facilities with smaller storage infrastructure with liquid under pressure. This information is on file with the Minnesota Department of Agriculture, Pesticide and Fertilizer Management Division.40

This suggests that if production of green ammonia and urea were to be constructed within Minnesota, there is an existing industry and infrastructure that could make ready use of it. It also suggests that any green ammonia produced would need to compete with the established gray ammonia industry, an important consideration in efforts to decarbonize ammonia production in ways that support farmers and Minnesota’s rural communities.

Next: Where to Built It

Where to Build It: Facility Geographic Siting Potential

Principal Siting Considerations

Proximity to substation infrastructure, high voltage power lines, and utility-scale renewable energy generation are critical to the financial viability of green ammonia. Minnesota’s strongest wind energy resources and some of its transmission assets align well with its areas of highest corn production (Figure 8). This is true for wind speeds at a conservative 80 meters, and, with the average hub height of land-based wind turbines constructed in the United States at a higher 90.1 meters (295.6 feet) in recent years, even more rural areas now have viable wind energy resources.41


Maps of Corn Acreage vs. Wind Speed in Minnesota

Figure 8: Corn Acreage vs. Wind Speed in Minnesota42


The availability of substation and transmission infrastructure to host wind-to-ammonia industrial facilities in Minnesota’s corn belt will, however, require further research and investigation. The state did add more high-voltage transmission in the last decade as a part of CAPX2020, an effort that constructed over 800 miles of high voltage transmission lines and substation infrastructure, mostly in southern and western Minnesota.43 Even so, Minnesota is already suffering from “grid lock” in its windiest areas because more wind-generated electricity is trying to flow on the lines than the lines can accommodate, requiring curtailment in some areas and reducing tax revenues for some counties with wind installations.44

Green ammonia generating facilities could make use of some of that additional wind energy by adding local electric consumption load, providing relief to congested power flow in southern and Western Minnesota. This area has, however suffered power quality and reliability issues that new industrial facilities might complicate.45 Thus, additional analysis of green ammonia’s potential impacts on the grid would help decision makers better understand the risks and benefits of local facility development on specific sites.

Existing Ammonia Terminals 

An initial consideration for siting green ammonia facilities could be at the existing large terminal ammonia storage tank facilities in Glenwood, Rosemount, Garden City, and Murdock. These sites are already distributed across Minnesota’s corn belt. These facilities already have ready storage for the product, and they are already tapped directly into an existing distribution network for their product. Co-location could further shorten the supply chains to get this product to market, and by locating facilities in a distributed fashion across the Minnesota agricultural landscape, access to power would put less strain in one large, concentrated area.

Co-locating Green Ammonia with Biorefineries

Given farmer preference for urea fertilizer in corn production, efforts to develop green ammonia may find opportunities in co-locating with ethanol facilities. To create urea, ammonia must be combined with carbon dioxide. Ethanol, which is produced through a fermentation process, creates carbon dioxide as a byproduct. A 100 million gallon per year ethanol facility produces approximately 330,000 tons of carbon dioxide in a near-pure waste stream.46

Leveraging these carbon dioxide waste streams to synthesize green ammonia into green urea—using wind and solar—is a realistic possibility.47 Minnesota currently ranks fifth in ethanol production nationwide and hosts 19 ethanol plants that produce 1.4 billion gallons of ethanol annually.48 Siting a new green ammonia facility directly adjacent to an ethanol plant has multiple potential benefits. Most ethanol facilities are located in Minnesota’s windiest regions, in close proximity to where corn is grown and where nitrogen fertilizer is used (Figure 9). Many of these facilities are also already served by robust electric infrastructure. Producing urea in conjunction with ethanol would also reduce the carbon dioxide emissions of the ethanol facility by capturing that CO2 as a useful product. While some of the carbon streams are currently used in other industries—ethyl alcohol production, carbonated beverage production, medical applications, and enhanced oil recovery49—not all facilities currently capture and make use of their CO2, and this use could be a win-win method of producing a needed farm product in rural areas. It might also facilitate ownership models that draw upon Minnesota's existing leadership in farmer-owned ethanol cooperatives.


Map of Minnesota's ethanol production facilities

Figure 9: Locations of Minnesota's ethanol production facilities—Minnesota Biofuels Association, 202250


Potential Benefits of Siting Distributed Ammonia Production in Minnesota

Minnesota farmers purchase, transport, and apply approximately 770,000 tons of nitrogen every year to the same corn fields where wind-to-green ammonia facilities could produce it locally. Using renewable energy to produce green ammonia thus offers multiple potential benefits. A key agricultural input can be produced locally, using local energy resources that otherwise might go unused, and providing economic benefits to Minnesota’s rural communities, even as dependence on fossil fuels (and accompanying emissions) is reduced for the agricultural sector.

In addition, while the value of improved resilience for Minnesota’s local communities and food system has not been quantified, that does not mean that the value is not there. What is the cost to Minnesota’s farmers and consumers from external shocks that drive up the cost of natural gas—and by extension, the cost of the conventional ammonia currently used to grow our food? What is the value of reducing the vulnerability of the nitrogen fertilizer supply by establishing shorter supply chains? These questions are beyond the scope of this study, but are worth considering, as the answers could help inform policy frameworks for development of this local industry.

Furthermore, since ammonia can be used as a form of chemical energy storage, it has potential uses as a carbon-free fuel for internal combustion engines, electricity generation, or thermal applications (e.g., grain drying). It can also be used as a low-cost hydrogen carrier and cracked for use (e.g., fuel cells). These applications are still under development but show significant promise. However, realizing green ammonia’s multiple benefits—for agriculture and beyond—would require alignment of economics and policy frameworks.

Next: The Economics

The Economics: Cost Drivers of Green Ammonia Production

Major cost drivers for green ammonia production are the capital costs to build a facility and the operational costs to keep the plant running while delivering a return on investment. While potential opportunities abound for utilizing green ammonia, the viability of these use cases is dependent upon markets, technology, costs, policy, systems integration, and more. The fertilizer market is a known potential primary market. An analysis of a techno-economic model of green ammonia production for this sector, given current commercially viable technologies, can identify the relative impacts of the major cost drivers for that production and highlight key levers that could advance scaling of these opportunities.

Capital Costs

The Agricultural Utilization Research Institute (AURI) led the assessment of the cost drivers behind commercial feasibility of green ammonia and, therefore, the potential to site these facilities in a distributed way closer to use sites in Minnesota. Technology itself is not a barrier. The Haber-Bosch process is well understood and commercialized. There are emergent technologies, like direct electrochemical conversion of ammonia, that present some benefits over Haber-Bosch synthesis, like the ability to ramp production up or down, but these technologies are still in development. This assessment therefore focuses on utilizing the Haber-Bosch production process to understand which costs are the biggest drivers of potential local green ammonia facilities.

Based on interest in distributed ammonia production, AURI selected the following facility sizes for modeling: 25, 50, 100, and 250 tons per day (tpd) of ammonia production. These sizes are much smaller than typical natural gas-based ammonia facilities, which average 1,500 tpd in the United States. Though, for context, a 250 tpd facility would supply approximately 50% of Minnesota’s current ammonia demand. A 250 tpd facility would also be 10 times larger than any existing electrolytic plant worldwide.

To conduct this assessment, AURI made the following assumptions:

  • A 250 tpd ammonia facility would require 10 MW of power
  • The facility would operate at a 30% utilization factor
  • Electrolyzer cell cost $700/kW
  • The electrolyzer stack would have a 10-year life (prorated maintenance cost built in)

Per Table 2 below, the capital costs for a 250 tpd facility are estimated at $4,889 per ton per day. A typical natural gas to ammonia facility at this scale costs about $2,000 per ton per day. This difference is largely attributed to the major factors contributing to the cost of electrolytic facilities that differ from conventional steam-methane reforming facilities: the cost of the electrolyzers and the need to overbuild the facility to achieve production when utilizing a variable power source. As shown in Table 2, as the facility size increases, the cost of electrolyzers grows linearly. In addition, with a facility utilization factor of 30%, the plant must be sized for 3 times the tpd output to ensure that these electrolyzers can run continuously.

 
Table 2: Capital Costs for Ammonia Production

Table of Capital Costs for Ammonia Production


To better understand the relative impact of these cost drivers, as well as the future potential for these facilities, AURI assessed what the potential impact of a reduction in electrolyzer costs (from $700/kWh down to $200/kWh) or an increase in the utilization factor of the facility (from 30% to 100%) could be on total project costs.

Using the 100 tpd example from Table 2, $200,510 is the base case in this assessment. Table 3 shows the potential impact of these changes.


Table 3: Potential Capital Cost Impact of Trends in Cell Costs and Utilization Factors for a 100 tpd plan (in $1000s)

Table of Potential Capital Cost Impact of Trends in Cell Costs and Utilization Factors for a 100 tpd plan (in $1000s)


An electrolytic cell has no moving parts; the primary cost component is the materials in the membrane. With materials development, current projections suggest these prices will decline from $700 per kW to $200-300 per kW. At the same utilization level, this would reduce capital costs by 35%. 

Increasing the utilization factor would lower capital costs by avoiding the need to “overbuild” the facility for an equivalent level of ton per day production. A utilization factor of 60% to 70%, even if electrolyzer costs held steady, would drive down capital costs by 30-35%.

The policy environment can have significant impacts on both direct capital costs (e.g., through incentives and low-interest financing) and utilization factor (e.g., by enabling virtual power purchase agreements). These will be discussed in the policy section below.

Operating Costs

Operationally, a green ammonia facility is cost competitive with a steam-methane reforming facility. Table 4 details the operating costs for a 100 tpd facility. This size facility is selected as a plant size that would match local demand in a Minnesota farming region such as Marshall.

This analysis shows operating costs of $388, or roughly $400 per ton of NH3 for this 100 tpd facility. This type of facility could cash flow today based only on direct operating costs. For context, ammonia is currently selling at $1,600 per ton, though, as previously noted, current ammonia prices are high compared to recent historical averages (see Figure 5, above). 


Table 4: Green Ammonia Facility Operating Costs

Table  of Green Ammonia Facility Operating Costs


While this production cost ensures good cash flow, to understand the potential for private capital to invest in this type of plant, with private investors typically looking for rates of return over 15%, the Unlevered Internal Rate of Return was assessed against ammonia sale prices $600 and $1,200 per ton (Table 5). This analysis shows that production costs would not yet be adequate to service a large enough amount of debt financing to satisfy commercial investors. To hit commercial financing expectations of rates of return over 15%, the cost of cells would need to fall toward the $200/kW cost estimate and/or the utilization factor would need to increase to the 50-70% range.


Table 5: Unlevered Internal Rate of Return of a 100 tpd plant

Table of Unlevered Internal Rate of Return of a 100 tpd plant


Utilization and Power Access

Utilization can be increased by steady access to power. This suggests a number of possible means to drive down capital costs: being able to source renewable energy from a geographically diverse set of suppliers, through multiple power purchase agreements (PPAs), at higher capacity factors, through wind/solar hybrid systems, and/or through systems coupled with power storage.

As demonstrated in Table 6, higher power prices can be paid if they lead to increased utilization. Indeed, at today’s cost of technology, the cost of power could double, but if that increase in cost could deliver power such that the facility could operate at 90% utilization, the internal rate of return would become positive. In other words, reducing capital costs (by increasing the percentage of time that the equipment can be used) is a more important factor than the cost of power (per kWh).


Table 6: Impact of Power Price and Utilization

Table of Impact of Power Price and Utilization


Hydrogen Costs on the Rise

As referenced above, conventional gray ammonia prices depend on the price of natural gas that is used to create the hydrogen.

High natural gas prices are bringing the undepreciated cash cost of electrolytic hydrogen virtually at parity with that of conventional hydrogen (Table 7). Given that the United States is currently ramping up capacity to export LNG, with the objective of supplying to Western Europe (which is currently highly dependent on imports of natural gas from Russia), it seems likely that US natural gas prices will trend upward overall, contributing to the economic competitiveness of green ammonia as compared to conventional gray ammonia.


Table 7: Electrolytic versus SMR hydrogen production costs

Table of Electrolytic vs SMR hydrogen production costs


Next: Assessing Potential Policy Levers

Assessing Potential Policy Levers: Frameworks and Incentives to Scale Adoption

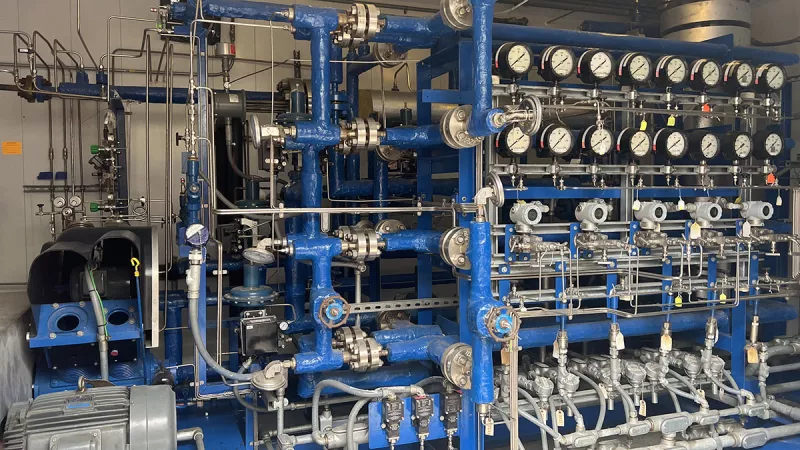
To drive down the cost of electrolyzers, production would need to ramp up. Current manufacturing is on the scale of megawatts (MW), but production on the scale of gigawatts (GW) would be needed to drive overall prices down into the $200-300/kW range. Like other technologies such as wind, solar, and ethanol, capital costs are high in this early phase of commercialization. As manufacturing ramps up, costs are expected to fall.

As will be seen in this section, despite green hydrogen and green ammonia’s application potential in Minnesota and the Midwest, the current policy framework may not be sufficient for developing the industry here. Existing low carbon fuel credit standards on the West Coast are designed to support and protect their West Coast market: wind or solar process energy that makes clean fuels in the Midwest will not deliver carbon credits under the West Coast regulatory structures. Another option, the federal tax credit for carbon credit and sequestration technologies, may present the possibility of additional incentives for green ammonia in the future, though it is unclear at this point whether green ammonia/urea would qualify for the credit. A third possibility—a green hydrogen tax credit—has been proposed but not yet passed. After consideration of these existing structures, the final part of this section will explore factors to consider with respect to a potential Midwest low carbon fuel standard—particularly the choice between physical and virtual power purchase agreements.

Existing Low Carbon Fuel Standards (LCFS)

Marketplaces providing bankable financial incentives for clean fuels (like green hydrogen and ammonia) exist only on the West Coast: California, Oregon, Washington and British Columbia.51 These states’ Low Carbon Fuel Standards (LCFS) rely on annual carbon intensity (CI) benchmarks,52 defined as the quantity of lifecycle greenhouse gas emissions per unit of fuel energy.53

Compliance with the LCFS relies on a carbon credit and deficit accounting system which is expressed in metric tons of CO2e. The carbon credits are monetized when regulated parties (businesses that produce or sell fossil fuels like gasoline, diesel, propane, and natural gas in these states)54 must purchase credits in a credit banking system to offset their carbon deficits. Regulated entities accumulate deficits when they produce fuels with a higher carbon intensity score than the LCFS target.55

For no- or low-carbon fuel project developers, there are three primary methods of generating carbon credits for incentive payments under LCFS standards:

  1. Fuels-based crediting: Entities that produce zero or low carbon fuels like green hydrogen, generate credits based on emissions reduced in comparison to the LCFS carbon intensity baseline. These credits incentivize project developers to produce clean fuel options for the LCFS West Coast markets.56
  2. Project-based crediting: These kinds of projects reduce emissions across the petroleum supply chain, including carbon capture and sequestration.57
  3. Zero-emissions vehicle infrastructure crediting: Installation of hydrogen fueling and DC electric fast charging infrastructure generates carbon credits based on capacity. These credits assist medium and heavy duty zero emissions vehicles in particular.58

To qualify as a low-carbon process energy source for the production of a low-carbon fuel in the West Coast LCFS markets, the energy from the generation source must be directly consumed in the fuel production process according to specific parameters:

  • The low-carbon intensity electricity must be supplied from generation equipment under the control of the low-carbon fuels producer. Any renewable energy certificates associated with the electricity cannot be retired or claimed under any other program with the exception of the federal Renewable Fuel Standard.
  • The generation equipment is directly connected through a dedicated line to the fuels production facility such that the generation and load are both physically located on the customer side of the utility meter.
  • The low-carbon fuel facility’s electric load is sufficient to match the amount of low-carbon intensity electricity claimed using a monthly balancing period.59 

This fuel-based crediting method does not allow indirect accounting mechanisms for low-carbon process energy, such as the purchase of renewable energy certificates or “greensleeve” power purchase agreements from renewable generation resources, unless those facilities supply power to one of the West Coast’s electric grid balancing authorities.60 To qualify, the wind or solar electric facility providing the process energy for low-carbon fuels production must be “behind the meter,” or feed renewable electricity directly into the grid under the control of West Coast states for the process energy to earn carbon credits.

These strict parameters put Minnesota and Midwestern-made green hydrogen, green ammonia, and biofuels at a competitive disadvantage in the West Coast markets, since any wind or solar process energy that makes clean fuels will not deliver carbon credits under the West Coast LCFS regulatory structures. Several non-West Coast states challenged the parameters of West Coast LCFS markets on legal grounds they violate the federal government’s exclusive authority to regulate commerce amongst the states. The Ninth Circuit Court of Appeals, however, denied these challenges, ruling that these states were merely exercising their state “police” powers by regulating in-state parties and in-state transactions via a carbon lifecycle accounting method for transportation fuels.61

45Q: Federal Tax Credit

The federal tax credit for carbon credit and sequestration technologies62 (also known as “45Q tax credit”) may present the possibility of additional financing options for green ammonia in the future. Recently, the Internal Revenue Service (IRS) set forth regulatory requirements for demonstrating the “secure geological storage of carbon oxide” and places heavy emphasis on permanent geological storage.63 However, the 45Q tax credit does include “chemical conversion of such qualified carbon oxide to a material or chemical compound in which such qualified carbon oxide is securely stored.”64 The IRS declined to comment on whether specific chemical processes that include fixing carbon dioxide into specific compounds would qualify for the 45Q tax credit.65 As it stands, the IRS has not made clear whether sequestering carbon dioxide in the form of green urea, and ultimately plant material, would qualify (and how) for the 45Q tax credit.

H2 Tax Credit

Proposed in 2021, the Build Back Better Act would have provided incentives to stimulate production of clean hydrogen. Producers could have utilized either a production tax credit of up to $3 a kilogram for 10 years or an investment tax credit of up to 30% of the cost of the electrolyzer and other equipment, claimed in the year the equipment was put into service.66 The actual credit amount per kg of hydrogen would have varied based on the quantity of CO2 emitted to produce a kilogram of hydrogen, as measured on a lifecycle basis.67 In July 2022, the US Inflation Reduction Act also included an up to $3 per kilogram tax credit for low-carbon hydrogen. Exact amounts of the credit are to be determined by the hydrogen’s full lifecycle greenhouse gas emissions and a project’s ability to meet “multiplier” criteria for in services dates and wage and labor requirements.68

Impacts of Potential Federal Incentives

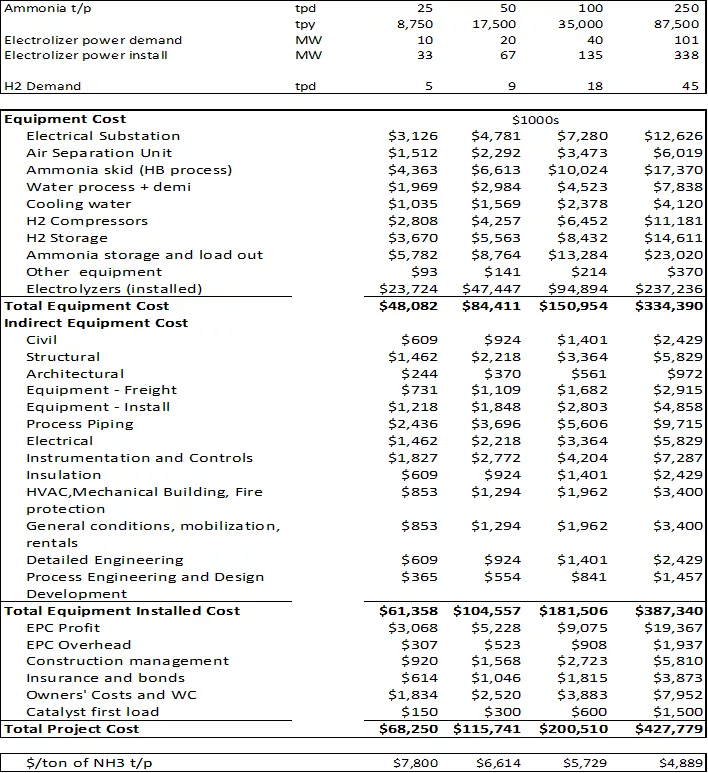
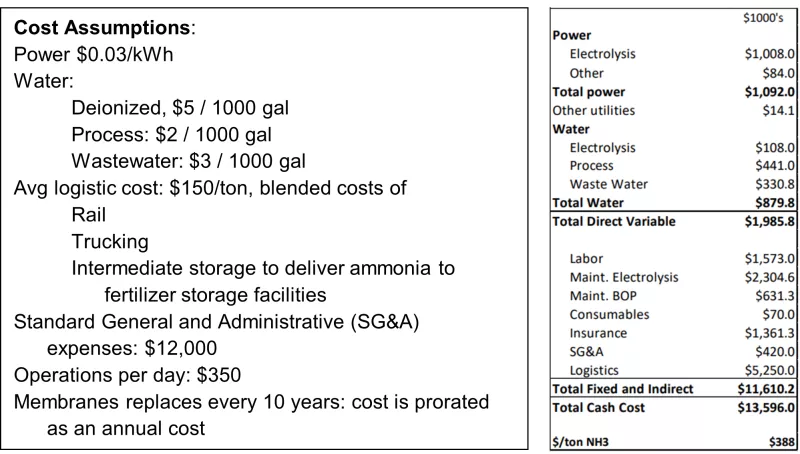
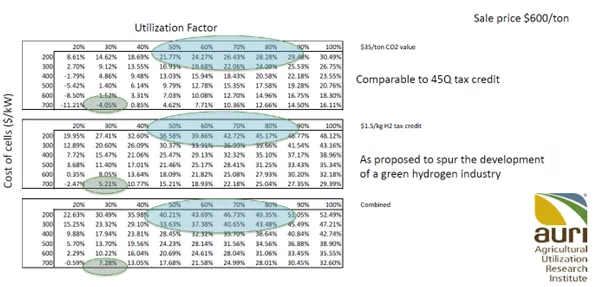
Table 8 highlights the potential impact that the 45Q tax credit and green hydrogen tax credit could play in scaling commercial investment in a green hydrogen industry. The values of the credits shown below are conservative estimates of the potential tax credit values. The 45Q tax credit value is estimated to provide a payment of $35/ton of CO2 avoided while the H2 tax credit is estimated at $1.50/kg H2.

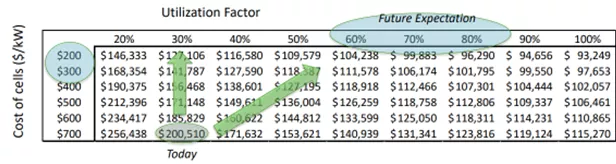
The unlevered internal rate of return (IRR) of a 100 tpd plant, without any tax credits or incentives, would not cash flow today at $600/tons. However, as Table 8 shows, a $1.50/kg H2 tax credit could, under existing conditions, increase the unlevered internal rate of return into positive percentages. Table 8 further shows that with either of these incentives facilities could capture positive IRRs with either a decrease in the cost of cells or an increase in the utilization factor, alone. With both increasing utilization factor and a decline in the cost of cells, these incentives would drive facilities into territory that would attract commercial investment.


Table 8: Unlevered IRR Impact of Potential Federal Incentives

Table of Unlevered IRR Impact of Potential Federal Incentives


Getting Local: Minnesota Department of Agriculture’s Renewable Chemical Production Incentive Program

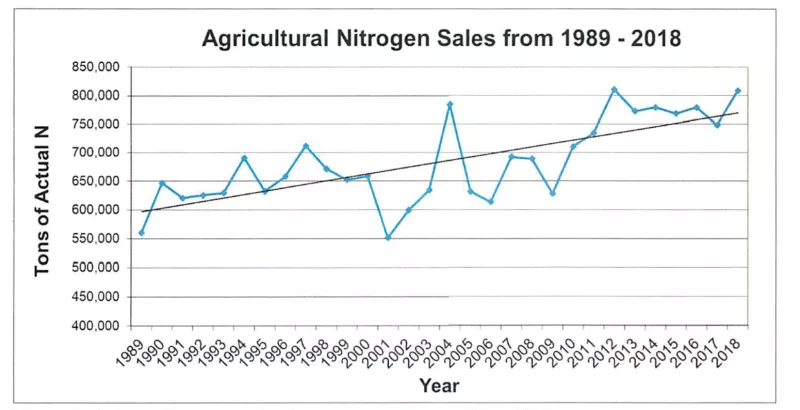
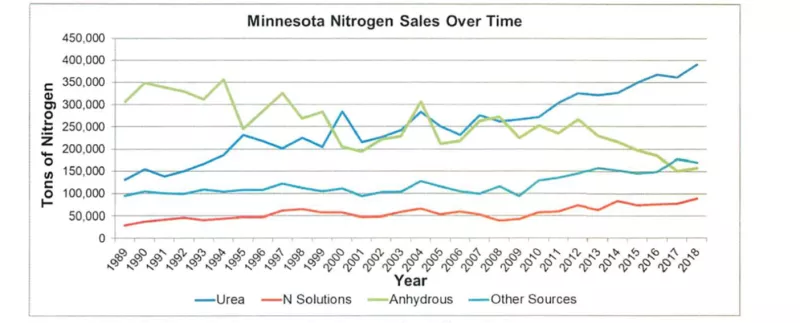
As mentioned previously, Minnesota farmers purchase approximately 350,000 tons of urea for application to farm fields.69 State law already exempts from sales and use tax the purchase or use of chemical fertilizers for use or consumption in agricultural production.70 In order to incentivize green urea purchase and use amongst farmers, policymakers could establish farm income tax credits or subsidize green urea production through mechanisms like the Minnesota Department of Agriculture’s Renewable Chemical Production Incentive Program. This program already bases incentives on pounds produced in a fiscal quarter, though it is geared toward cellulosic biomass and sugars.71 There is a strong market for urea sales and use, and further economic study would assist in identifying effective ways to finance these developments.

Getting Local: Frameworks for a Midwest Low-Carbon Fuel Standard

Thoughtful design of a Midwest low-carbon fuel standard could attract investors to Minnesota and help this budding industry weather market uncertainties. Minnesota’s low-cost wind generation positions it well to use clean energy to produce green ammonia for fertilizer or fuel. Most, if not all, utility-scale wind and solar generation facilities in Minnesota participate in the renewable energy tracking platform, M-RETs72, and feed electricity into the Midcontinent Independent System Operator (MISO), the grid balancing authority for 15 states and the province of Manitoba, Canada.73

Physical delivery power purchase agreements (PPAs) and virtual power purchase agreements (VPPAs) of green energy may be the simplest paths for qualifying green ammonia under an environmental attribute market program such as a low carbon fuel standard.

Physical PPA Framework

Under a physical delivery PPA, the purchaser, in this case the ammonia facility, would take full ownership of the electrons and renewable energy credits from the renewable energy project. The corporate buyer is responsible for monetizing the electrons in the wholesale electricity marketplace and/or via a product sale, such as green ammonia. Additionally, the corporate buyer may be responsible for any transmission costs associated with the renewable energy project.74 This arrangement matches the West Coast LCFS markets’ behind-the-meter requirements for process energy.

For example, the University of Minnesota’s West Central Research and Outreach Center near Morris recently announced plans and funding for a direct power delivery green ammonia project.75 The proposed project will build and operate a commercial-scale wind energy to green ammonia facility that produces one metric ton of low- and zero-carbon ammonia daily. The wind turbines powering the green ammonia facility will be located behind the meter and dedicate renewable energy credits (RECs) to green hydrogen and ammonia production.

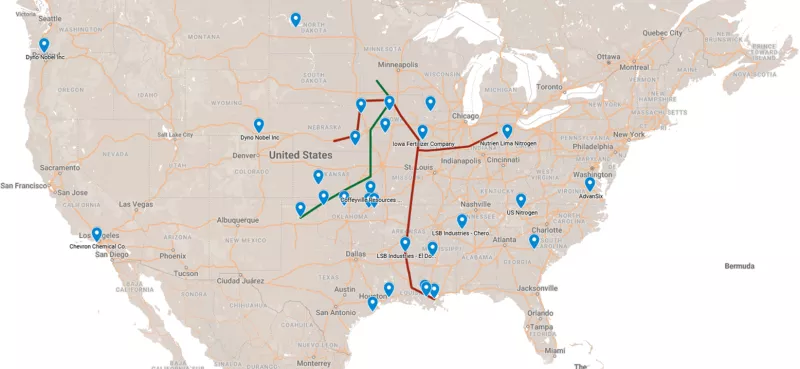
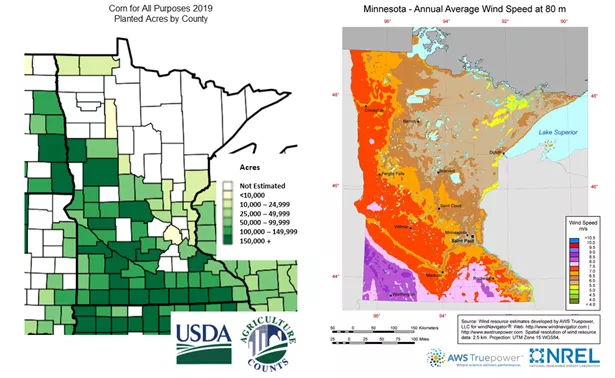
Other projects could also be designed for this behind-the-meter set-up with siting of a facility to directly serve the plant. One could look at ammonia sales by county and compare the wind resource to identify areas of alignment, as depicted in Figure 10.76 Green ammonia facilities and associated renewable energy generation could also be sited close to existing ammonia storage facilities. 


Map of MN match between wind potential and ammonia demand

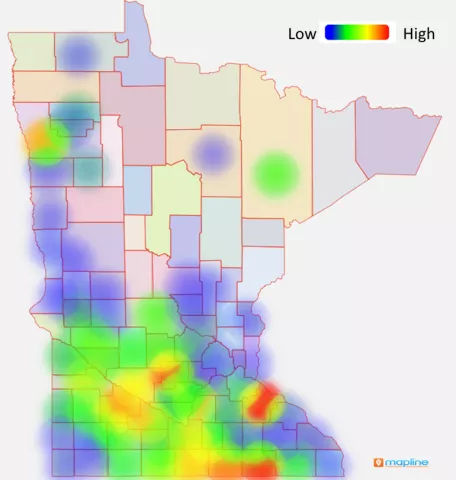
Figure 10: Match between wind potential and ammonia demand


As another example in Washington, the Douglas County Public Utilities District recently broke ground on a 5MW green hydrogen production facility based on their Wells Hydroelectric Project.77 The project puts to use a seasonal over-supply of hydroelectric power that previously resulted in negative power-pricing, much like occasional oversupply of wind in the Upper Midwest. The Douglas County PUD also holds a private contract with Toyota Motor North America to purchase the zero-carbon hydrogen output for fuel cell use.78 As a part of this development, a current bill in the Washington State Legislature would authorize and incentivize the expansion of hydrogen refueling stations via tax exemptions. As proposed, the bill would allow public utility districts and municipal utilities the ability to produce, use, sell, and distribute green electrolytic hydrogen.79

Minnesota policymakers could leverage a similar set of tax exemptions to encourage the construction of hydrogen fuel infrastructure and possibly enable a new revenue source for utilities that are transitioning to zero-carbon energy sources. This approach suggests aligning production with prime wind and solar resource locations, even if there are grid constraints, to maximize the renewable energy capacity of these facilities.

Virtual PPA Framework

Another option is the virtual power purchase agreement. Under a VPPA, the corporate buyer purchases power from the electric utility and the renewable energy certificates from the renewable energy project owner. The VPPA is entirely a financial transaction. The corporate buyer’s relationship with the utility remains unchanged at the retail electricity level. The corporate buyer still meets any energy needs through traditional utility energy supply, but it has “greened” its energy source through the purchase of renewable energy certificates which are measured and verified in megawatt-hour certificates by a third party.80 Virtual power purchase agreements for wind or solar energy in the Midwest might mirror the West Coast LCFS regulations regarding process energy by supplying power into the Midwest’s grid balancing authority, MISO. Arguably, this would give Midwestern-made clean fuels a competitive advantage in the fuels marketplace because of MISO’s larger footprint and lower-cost process energy.

Regulation that enables VPPAs for green ammonia would free up these facilities to site on the electric grid where they are most advantageous. This could include sections of the electric grid with congestion issues or near existing anhydrous ammonia storage facilities like those in Glenwood, Murdock, Garden City, or Rosemount mentioned above. Physical PPAs which would require sizing the renewable energy generation facility to a green ammonia plant size, and simultaneously anticipate the ammonia marketplace, could introduce capital risk and higher levelized costs.81 VPPAs for green ammonia would avoid this capital project complication.

However, whether green ammonia facilities could source renewables for green VPPAs in MISO requires more examination. A VPPA for renewable power could mitigate price uncertainty, but most of the wind-rich areas within MISO suffer from congestion and undergo economic curtailment at certain times of the year.82  Alternatively, a project could procure renewable energy certificates (RECs) on the open market. However, availability of RECs is from existing facilities is difficult to discern as the data from M-RETs public reports only show annual production and retirement data.83 Additionally, there is risk in relying on the market to procure RECs as prices can experience wide fluctuations.84 Availability of green power for VPPAs, or even through RECs, thus remains an open question.  


Map of Negative Price Frequency and detailed geographic location of areas where wind is economically curtailed because of lack of transmission capacity and wind energy volume.

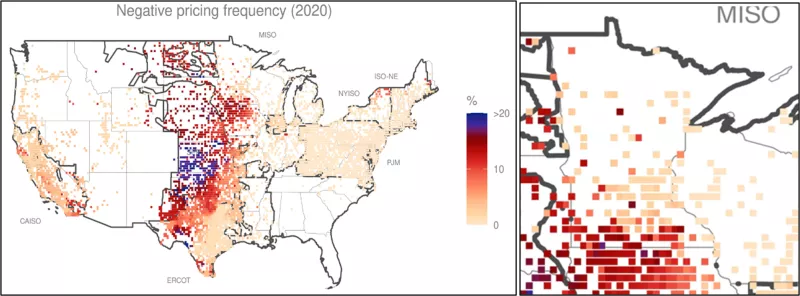
Figure 11: Berkeley Lab’s Renewables and Wholesale Electricity Prices Tool—Negative Price Frequency and detailed geographic location of areas where wind is economically curtailed because of lack of transmission capacity and wind energy volume.


Next: Conclusion

Conclusion

Green ammonia technology is viable, but the capital costs are the major factor in scaling up local production. It is anticipated that the prices of electrolyzers will come down, but incentives—debt financing, production incentives—would be needed to drive down the costs more quickly and to scale the industry. Similarly, the other key factor, utilization, speaks to the need to get a more constant stream of green power and create mechanisms that facilitate both scaling power production and power access for these facilities.

Large and centralized is often the path of least resistance. However, having green ammonia production distributed across the region is a potentially beneficial path. It could be scaled to local use cases, would be less power constrained, would potentially free up power movement, and would also reduce logistics and transport costs. Finally, because hydrogen and ammonia can be used for many purposes beyond fertilizer, commercializing a system for fertilizer (a known market and technology) can begin to scale deployment, enabling future applications for energy storage, transport, and use across the state and region.

Green ammonia could be a strategy for economic development and resilience in Minnesota’s rural communities: produce our own fertilizer, owned by our local cooperatives, supplied by our local energy resources. 

Next: Credits

CREDITS

Funding made possible through an Institute on the Environment Impact Grant. 

The original project partners included: 

Fritz Ebinger, Clean Energy Resource Teams (CERTs) Program Manager for Rural Energy Development, University of Minnesota Extension Regional Sustainable Development Partnerships (RSDP)

Shannon Stassen, Program Associate for Clean Energy and Resilient Communities – NW CERT and RSDP 

Mike Reese, Director of Renewable Energy at the West Central Research and Outreach Center

Harold Stanislawski, Business Development Director at the Agricultural Utilization Research Institute (AURI)

Rod Larkins, Senior Director of Science & Technology at AURI

Additional collaborators who joined the team to finalize the project analysis and report included:  

Lissa Pawlisch, CERTs Director

Melissa Birch, Rural Energy Development Manager & Central CERT Coordinator

Luca Zullo, Sr. Director of Science and Technology, AURI

Next: Notes

Notes

Clean Grid Alliance, Minnesota Wind Energy Facts, https://cleangridalliance.org/minnesota-wind-energy.
Minnesota Department of Revenue, County Energy Production, 2020 wind and solar revenues all counties, https://www.mndor.state.mn.us/ReportServer/Pages/ReportViewer.aspx?/Property%20Tax/Property_Tax_Energy_County.
Minnesota Pollution Control Agency, Biennial Greenhouse Gas Emissions Inventory (2005-2018), March 2021, 5, https://www.pca.state.mn.us/sites/default/files/lraq-1sy21.pdf.
Kari Lydersen, “Grid congestion a growing barrier for wind, solar developers in MISO territory,” Energy News Network, September 29, 2020, https://energynews.us/2020/09/29/grid-congestion-a-growing-barrier-for-wind-solar-developers-in-miso-territory/.
Jeffrey Tomich, “Renewables ‘hit a wall’ in saturated Upper Midwest grid,” E&E News, Dec. 13, 2019, https://www.eenews.net/stories/1061787851.
Minnesota Department of Commerce, Minnesota Energy Storage Cost-Benefit Analysis, Dec. 31, 2019, https://mn.gov/commerce-stat/pdfs/energy-storage-cost-benefit-study-2020.pdf.
Jeff Haase, “Electric Thermal Storage Water Heating: The Battery in Your Basement,” Energy Transition, July 15, 2015, http://energytransition.umn.edu/wp-content/uploads/2015/06/JHAASE_ETS-Water-Heating-UMN.pdf. (Noting storage capacity of over 300 gigawatt-hours of storage annually across 65,000 electric thermal storage hot water heaters.)
Connexus Energy, “Connexus Energy’s Solar + Storage project begins commercial operations,” January 3, 2019, Connexus Energy, https://www.connexusenergy.com/blog/2019/connexus-energys-solar-storage-project-begins-commercial-operations/; Connexus Energy, “Solar + Storage in Ramsey and Athens Township,” Nov. 18, 2018, Connexus Energy, https://www.connexusenergy.com/blog/2018/solar-storage-in-ramsey-and-athens-township/. (Noting that Connexus Energy uses 3,150 lithium iron phosphate batteries to store output from two utility-scale solar arrays for dispatch during peak load.)
Minnesota Pollution Control Agency, “Greenhouse gas reduction potential of agricultural best management practices,” October 2019, 1, https://www.pca.state.mn.us/sites/default/files/p-gen4-19.pdf.
10 Michael Reese, “Fueling Sustainable Energy and Agriculture: Putting Wind in a Bottle,” March 2020, West Central Research and Outreach Center, https://wcroc.cfans.umn.edu/research/renewable-energy/bottling-wind.
11 Id.
12 The Royal Society, Ammonia: zero-carbon fertiliser, fuel and energy store - policy briefing, February 2020, https://royalsociety.org/-/media/policy/projects/green-ammonia/green-ammonia-policy-briefing.pdf.
13 Air Liquide, “Autothermal Reforming Syngas Generation,” Air Liquide, 2022, https://www.engineering-airliquide.com/autothermal-reforming-atr-syngas-generation.
14 R. Jean, “North Dakota blue hydrogen hub to be operational by 2026 after agreement reached for Synfuels Plant,” Williston Herald, August 15, 2021, https://www.willistonherald.com/news/oil_and_energy/north-dakota-blue-hydrogen-hub-to-be-operational-by-2026-after-agreement-reached-for-synfuels/article_a2a2fb6c-febb-11eb-97d9-2b594c4c52c4.html.
15 Cedric Philibert, “Methane Splitting and Turquoise Ammonia,” Ammonia Energy Association, May 14, 2020, https://www.ammoniaenergy.org/articles/methane-splitting-and-turquoise-ammonia/.
16 Mary Paige Bailey, “SK Inc. leads investment in Monolith Materials to accelerate green hydrogen,” Chemical Engineering, June 3, 2021, https://www.chemengonline.com/sk-inc-leads-investment-in-monolith-materials-to-accelerate-u-s-green-hydrogen-expansion/; Mitsubishi Heavy Industries, “Mitsubishi Heavy Industries invests in Monolith Materials,” Mitsubishi Heavy Industries, Nov. 30, 2020, https://www.mhi.com/news/201130.html; Matt Olberding, “Lincoln company receives more investment,” Lincoln Journal Star, June 3, 2021, https://journalstar.com/business/local/lincoln-company-receives-more-investment/article_f1a16225-ba83-56d3-9ea7-83cf0a007ca0.html.
17 Associated Press, “Monolith, NPPD Sign Large Renewable Energy Agreement,” U.S. News & World Report, Jan. 4, 2021, https://www.usnews.com/news/best-states/nebraska/articles/2021-01-04/monolith-nppd-sign-large-renewable-energy-agreement.
18 Matt Olberding, “With NRD well approval, Monolith Materials set to start on expansion south of Lincoln,” Lincoln Journal Star, July 1, 2020, https://journalstar.com/business/local/with-nrd-well-approval-monolith-materials-set-to-start-on-expansion-south-of-lincoln/article_6f434278-4664-5f71-9d5a-6cfd9aeca214.html.
19 Yusef Bicer and Ibrahim Dincer, “Life cycle assessment of nuclear-based hydrogen and ammonia production options: A comparative evaluation,” Intl. Journal of Hydrogen Energy, August 2017, 42 (33) 21559-21570, https://www.sciencedirect.com/science/article/pii/S0360319917304147?casa_token=B_R-StMfW8AAAAAA:4TMO0R8T-SitIE7fqQScMAcwdhjNcQWgTDPLI26G3fZ6lZl8XE4i_LvVI9pJGDBEOPfgHz3muA.
20 Id. at 21561.
21 Keith Ridler, “U.S. nuclear lab partnering with utility to produce hydrogen,” PBS News Hour, Nov. 11, 2020, https://www.pbs.org/newshour/nation/u-s-nuclear-lab-partnering-with-utility-to-produce-hydrogen.
22 Minnesota Department of Agriculture, 2017 Crop Year Fertilizer Sales Report, May 2020, https://www.mda.state.mn.us/sites/default/files/docs/2020-05/2017fertsalesreport.pdf.
23 Id.
24 Id.
25 University of Minnesota Extension, Nitrogen fertilizer economics: Urea vs. anhydrous ammonia, on-farm storage options, & more, March  27, 2020, https://blog-crop-news.extension.umn.edu/2020/05/nitrogen-fertilizer-economics-urea-vs.html.
26 Jerry Kramer and agronomy team (New Horizons CHS—Herman Facility), interview, 2021.
27 Direct conversations with the Pesticide & Fertilizer Division contacts for the North Dakota and Iowa Departments of Agriculture confirmed data sets on fertilizer exports are not recorded.
28 Basin Electric Cooperative, 2020 Annual Report, March 2021, 10 and 46, https://www.basinelectric.com/_files/pdf/financials/Annual-Report-2020-WEB.pdf.
29 Rod Swoboda, “New $3 billion fertilizer plant opens in Iowa,” The Farmer, April 24, 2017, https://www.farmprogress.com/business/new-3-billion-fertilizer-plant-opens-iowa.
30 M. Dockter, “Progress: CF Industries’ new plants have ‘exceeded our expectations,’ The Sioux City Journal, May 6, 2019, https://siouxcityjournal.com/special-section/local/industry/progress-cf-industries-new-plants-have-exceeded-our-expectations/article_9da73869-4a65-5cc3-a5b3-acbeb218945d.html.
31 Business Wire, “CF Industries Announces Completion of Port Neal, Iowa, Capacity Expansion Project,” Business Wire, Dec. 28, 2016, https://www.businesswire.com/news/home/20161228005246/en/CF-Industries-Announces-Completion-of-Port-Neal-Iowa-Capacity-Expansion-Project.
32 Green Valley Chemical, “Green Valley Chemical,” http://www.greenvalleychemical.com/Green_Valley_Chemical/Home.html; Ammonia Industry, “Green Valley Chemical,” Accessed 2022, https://ammoniaindustry.com/creston-ia-green-valley-chemical/.
33 Nasdaq.com, “CVR Partners Generates First Carbon Offset Credits Related to Voluntary Nitrous Oxide Abatement Efforts,” Nasdaq.com, Oct. 5, 2020, https://www.nasdaq.com/press-release/cvr-partners-generates-first-carbon-offset-credits-related-to-voluntary-nitrous-oxide.
34 U.S. Energy Information Administration, “U.S. ammonia prices rise in response to higher international natural gas prices,” US EIA, May 10, 2022, https://www.eia.gov/todayinenergy/detail.php?id=52358#
35 Id.
36 Argus Media, “Magellan Midstream to decommission ammonia pipeline,” Argus Media, January 31, 2019, https://www.argusmedia.com/en/news/1839099-magellan-midstream-to-decommission-ammonia-pipeline.
37 Gary Schnitkey, N. Paulson, C. Zulauf, K. Swanson, J. Colussi and J. Baltz, "Nitrogen Fertilizer Prices and Supply in Light of the Ukraine-Russia Conflict," farmdoc daily (12):45, Department of Agricultural and Consumer Economics, University of Illinois at Urbana-Champaign, April 5, 2022, https://farmdocdaily.illinois.edu/2022/04/nitrogen-fertilizer-prices-and-supply-in-light-of-the-ukraine-russia-conflict.html.
38 U.S. Department of Agriculture National Agricultural Statistics Service, 2017 Census of Agriculture Online Resources: Ag Census Web Maps, https://www.nass.usda.gov/Publications/AgCensus/2017/Online_Resources/Ag_Census_Web_Maps/Overview/.
39 Map developed by Luca Zullo, AURI, using google maps referencing facility locations and pipelines from other sources including https://www.ammoniaenergy.org/articles/hydrogen-ammonia-developments-in-the-usa/, https://www.researchgate.net/publication/331595915_Potential_Roles_of_Ammonia_in_a_Hydrogen_Economy, and https://www.enr.com/articles/51336-landowners-sue-over-1100-mile-ammonia-pipeline-they-claim-is-abandoned. Pipeline locations are only approximate. 
40 Minnesota Department of Agriculture, “Pesticide and Fertilizer Management Division, Fertilizer Sales and Use Data,” MDA, Accessed 2022, https://www.mda.state.mn.us/pesticide-fertilizer/fertilizer-use-sales-data
41 U.S. Department of Energy, Land-Based Wind Market Report: 2021 Edition, August 2021, https://www.energy.gov/sites/default/files/2021-08/Land-Based Wind Market Report 2021 Edition_Full Report_FINAL.pdf
42 U.S. Department of Agriculture National Agricultural Statistics Service, “Corn County Maps: Planted Acreage by County,” USDA, retrieved 2022, https://www.nass.usda.gov/Charts_and_Maps/Crops_County/index.php#cr;
U.S. Department of Energy - Office of Energy Efficiency and Renewable Energy and the National Renewable Energy Laboratory, “Minnesota 80 Meter Wind Resource Map,” Windexchange, retrieved 2022, https://windexchange.energy.gov/maps-data/63
43 Marta C. Monti et al. Transmission Planning and CapX2020: Building trust to build regional transmission, April 2016, https://gridnorthpartners.com/wp-content/uploads/2021/03/uofm-humphrey_capx2020_final_report.pdf; See also Grid North Partners, “Projects,” https://gridnorthpartners.com/projects/
44 Minnesota Department of Commerce, Minnesota’s Electric Transmission System—Annual Adequacy Report, January 12, 2022, 13, https://www.house.leg.state.mn.us/comm/docs/5085ISkFrE6Ed8AqqQoScw.pdf; Mike Hughlett, “Power line congestion leads to wind turbine shutdowns, denting county budgets,” Star Tribune, July 5, 2022, https://www.startribune.com/power-line-congestion-leads-to-wind-turbine-shutdowns-denting-county-budgets/600187596/.
45 Id.
46 R. Hartley, “The door is open for ethanol producers and CCS,” Ethanol Producer Magazine, R. Hartley, The door is open for ethanol producers and CCS, May 14, 2020, (reprinted from EcoEngineers), http://ethanolproducer.com/articles/17176/the-door-is-open-for-ethanol-producers-and-ccs.
47 Uisung Lee et al, “Using waste CO2 from corn ethanol biorefineries for additional ethanol production: life-cycle analysis,” Biofuels, Bioproducts & Biorefining, November 19, 2020, https://www.researchgate.net/publication/347736963_Using_waste_CO_2_from_corn_ethanol_biorefineries_for_additional_ethanol_production_life-cycle_analysis; see also M. Alfian and W. Purwanto, “Multi-objective optimization of green urea production,” Energy Science & Engineering, April 2019, 7 (2) (noting solar electrolysis for use in green urea production becomes more viable as capital expenditures continue to drop). https://onlinelibrary.wiley.com/doi/10.1002/ese3.281.
48 Minnesota Biofuels Association, Production in Minnesota, March 2022, https://www.mnbiofuels.org/resources/production-in-minnesota.
49 Grandview Research, Carbon Dioxide Market Size, Share & Trends Analysis Report By Source (Ethyl Alcohol, Substitute Natural Gas), By Application (Food & Beverage, Medical), By Region, and Segments Forecast, 2021-2018, June 2021, https://www.grandviewresearch.com/industry-analysis/carbon-dioxide-market.
50 Minnesota Bio-fuels Association, “Production in Minnesota,” retrieved 2022, https://www.mnbiofuels.org/resources/production-in-minnesota.
51 Congressional Research Service, A Low Carbon Fuel Standard: In Brief, July 7, 2021 (R46835), https://sgp.fas.org/crs/misc/R46835.pdf.
52 California Code of Regulations, 17 CCR §954884 (2021).
53 Id. at §95481(a)(26).
54 California Code of Regulations, 17 CCR §95482 (2021).
55 Id. at §95483.2.
56 Id. at §95486.1.
57 Id. at §95490.
58 Id. at §95486.2; see also U.S. Gain, Understanding the California Low Carbon Fuel Standard (LCFS), July 20, 2020, https://www.usgain.com/blog/understanding-the-california-low-carbon-fuel-standard-lcfs/.
59 California Code of Regulations, 17 CCR §95488.8(h) (2021).
60 Id. at §95488.8(i) (California grid balancing authorities include CAISO, Los Angeles Dept. of Water and Power, Balancing Authority of Northern California, Imperial Irrigation District, and Turlock Irrigation District; Washington session law 2021, ch. 317, “Transportation Fuel – Clean Fuels Program,” Sec. 17, July 25, 2021, https://lawfilesext.leg.wa.gov/biennium/2021-22/Pdf/Bills/Session Laws/House/1091-S3.SL.pdf#page=1 (stating “associated facilities” for process power must be connected to the northwest power grid).
61 Rocky Mountain Farmers Union v. Corey, 730 F. 3d 1070 (9th Cir. 2013) (Rocky Mountain I); Rocky Mountain Farmers Union v. Corey, 913 F.3d 940 (9th Cir. 2019) (Rocky Mountain II) (Minnesota Corn and Soybean Growers joined as plaintiffs); American Fuel & Petrochemical Manufacturers v. O’Keefe No. 15-35834 (9th Cir. 2018).
62 26 U.S.C. 45 (2020).
63 86 Fed. Reg. 4728-4773, Jan. 15, 2021, https://www.govinfo.gov/content/pkg/FR-2021-01-15/pdf/2021-00302.pdf; Congressional Research Service, Carbon Storage Requirements in the 45Q Tax Credit, June 28, 2021, https://crsreports.congress.gov/product/pdf/IF/IF11639/5.
64 26. U.S. 45(Q)(f)(5).
65 86 Fed. Reg. at 4749.
66 https://www.projectfinance.law/publications/2021/december/hydrogen-funding-and-tax-credits/#:~:text=The%20%E2%80%9CBuild%20Back%20Better%E2%80%9D%20bill,the%20electrolyzer%20and%20other%20equipment, accessed June 7, 2022. 
67 https://www.bakermckenzie.com/en/insight/publications/2021/07/us-hydrogen-tax-incentives-should-spur-investment, accessed June 7, 2022 
68 S&P Global Commodity Insights, Hydrogen tax credits preserved in new US Inflation Reduction Act, July  29, 2022, https://www.spglobal.com/commodityinsights/en/market-insights/latest-news/energy-transition/072822-hydrogen-tax-credits-preserved-in-new-us-inflation-reduction-act.
69 Minnesota Department of Agriculture, Fertilizer Use and Sales Data, https://www.mda.state.mn.us/pesticide-fertilizer/fertilizer-use-sales-data (listing 2010-2018 Crop Year Fertilizer Sales Reports).
70 Minn. Admin. Rule 8130.550 (2022).
71 Minnesota Department of Agriculture, Renewable Chemical Production Incentive Program, 2022, https://www.mda.state.mn.us/environment-sustainability/renewable-chemical-production-incentive-program, (stating eligibility for facilities that produce at least 250,000 lbs of green chemicals per quarter).
72 M-RETS, www.mrets.org; see also B. Gerber, M-RETS: A Path to Supporting Data-Driven Renewable Energy Markets, March 2021, https://www.mrets.org/wp-content/uploads/2021/02/A-Path-to-Supporting-Data-Driven-Renewable-Energy-Markets-March-2021.pdf (noting M-RETS’ launch of hourly tracking data to enhance renewable energy tracking and capture fractional renewable energy certificates).
73 MISO, https://www.misoenergy.org/.
74 Aaron Larson, “Types of Power Purchase Agreements and Why Each PPA Might Be Used,” Sept. 1, 2021, PowerMag.com, https://www.powermag.com/types-of-power-purchase-agreements-and-why-each-ppa-might-be-used/.
75 University of Minnesota—West Central Research and Outreach Center, “Renewable Energy Ammonia Production Research Continues at WCROC,” WCROC, May 7, 2021, https://wcroc.cfans.umn.edu/news/arpa-e-ammonia-project.
76 Figure developed by Luca Zullo, AURI, using Minnesota Department of Agriculture Ammonia sales and NREL Wind MAP.
77 Douglas County Public Utility District, “Renewable Hydrogen Production Facility,” DC PUD, March 8, 2021, https://douglaspud.org/renewable-hydrogen-production-facility-groundbreaking-d30/.
78 Fuel Cell Works, “Douglas County PUD to Acquire 409 Acres for Hydrogen Facility,” FCW, March 17, 2022, https://fuelcellsworks.com/news/douglas-county-pud-to-acquire-409-acres-for-hydrogen-facility-wells-dam-project/.
79 Washington State Legislature, House Bill 1792 (2021-2022 Regular Legislative Session), https://app.leg.wa.gov/billsummary?BillNumber=1792&Year=2021&Initiative=false; Jared Wenzelburger, “Bill Expanding Utility Production, Sale of Hydrogen Passes House Committee,” The Chronicle, Bill Expanding Utility Production, Sale of Hydrogen Passes House Committee, Jan. 21, 2022, https://www.chronline.com/stories/bill-expanding-utility-production-sale-of-hydrogen-passes-house-committee,283082.
80 Rachit Kansal, Rachit, Introduction to the Virtual Power Purchase Agreement, Rocky Mountain Institute, November 2018, https://rmi.org/wp-content/uploads/2018/12/rmi-brc-intro-vppa.pdf.
81 R. Nayak-Luke, R. Bañares-Alcántara, and I. Wilkinson, “Green” Ammonia: Impact of Renewable Energy Intermittency on Plant Sizing and Levelized Cost of Ammonia,” Industrial & Engineering Chemistry Research, 2018, 57 (43), 14613 DOI: 10.1021/acs.iecr.8b02447.
82 Midcontinent Independent System Operator, Markets of the Future: A reliability imperative report, Nov. 2021., https://cdn.misoenergy.org/MISO Markets of the Future604872.pdf
83 Personal communication with M-RETs in February 2022. Public Reports are found: https://app.mrets.org/reports/public
84 Id.

Next: Slides